Figure 1
Deciphering the Rosetta Stone - Trans-Mitral Doppler Patterns for a Simplified Study of Left Ventricular Systolic Dysfunction
George Thomas*
Published: 30 August, 2023 | Volume 7 - Issue 1 | Pages: 008-011

Figure 1:
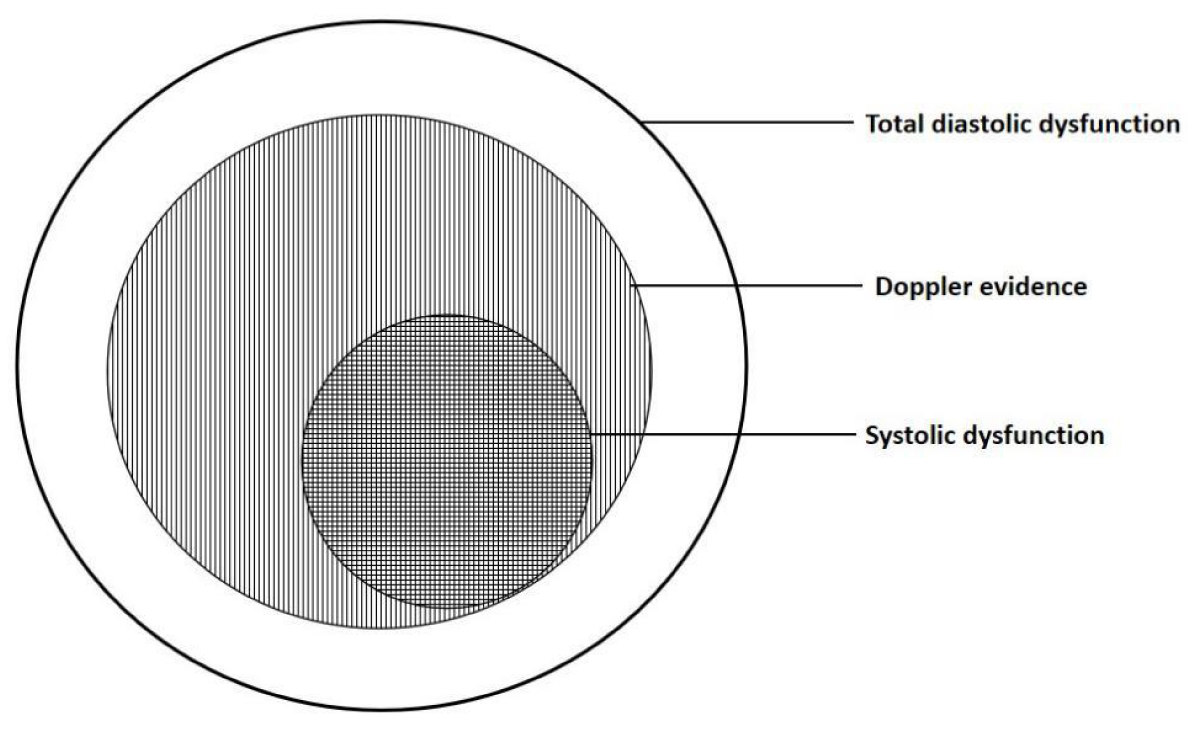
Figure 1: Schematic diagram of cardiac dysfunction.
Cardiac dysfunction starts with diastolic dysfunction. The clear area shows cardiac dysfunction without Doppler abnormalities. Doppler evidence is shown as the vertical hatched area. This also includes systolic dysfunction shown as the horizontal hatched area. This overlaps the vertical hatched area. Thus Doppler evaluation is more specific for systolic dysfunction.
Read Full Article HTML DOI: 10.29328/journal.ijcar.1001023 Cite this Article Read Full Article PDF
More Images
Similar Articles
-
Deciphering the Rosetta Stone - Trans-Mitral Doppler Patterns for a Simplified Study of Left Ventricular Systolic DysfunctionGeorge Thomas*. Deciphering the Rosetta Stone - Trans-Mitral Doppler Patterns for a Simplified Study of Left Ventricular Systolic Dysfunction. . 2023 doi: 10.29328/journal.ijcar.1001023; 7: 008-011
Recently Viewed
-
Response of Chemical Fertilisation on Six-year-old Oil Palm Production in Shambillo-Padre Abad- UcayaliEfraín David Esteban Nolberto, Guillermo Gomer Cotrina Cabello*, Robert Rafael-Rutte, Jorge Luis Bringas Salvador, Mag. Carmen Luisa Aquije Dapozzo, Guillermo Vilchez Ochoa, Luis Alfredo Zúñiga Fiestas, Nancy Ochoa Sotomayor, Mg. Merici Medina Guerre. Response of Chemical Fertilisation on Six-year-old Oil Palm Production in Shambillo-Padre Abad- Ucayali. Arch Food Nutr Sci. 2024: doi: 10.29328/journal.afns.1001058; 8: 024-028
-
Physiotherapy Undergraduate Students’ Perception About Clinical Education; A Qualitative StudyBimika Khadgi,Pravakar Timalsina*. Physiotherapy Undergraduate Students’ Perception About Clinical Education; A Qualitative Study. J Nov Physiother Rehabil. 2024: doi: 10.29328/journal.jnpr.1001063; 8: 043-052
-
Current Practices for Severe Alpha-1 Antitrypsin Deficiency Associated COPD and EmphysemaMJ Nicholson*, M Seigo. Current Practices for Severe Alpha-1 Antitrypsin Deficiency Associated COPD and Emphysema. J Pulmonol Respir Res. 2024: doi: 10.29328/journal.jprr.1001058; 8: 044-047
-
Responding to disasters: about the governance of post-nuclear accident situationsJacques Lochard*. Responding to disasters: about the governance of post-nuclear accident situations. Arch Psychiatr Ment Health. 2023: doi: 10.29328/journal.apmh.1001045; 7: 001-003
-
Forensic Psychology and Criminal ProfilingEze SM*,Alabi KJ,Yusuf AO,Hamzat FO,A Abdulrauf,Atoyebi AT,Lawal IA,OA Ibrahim,AY Imam-Fulani,Dare BJ. Forensic Psychology and Criminal Profiling. J Forensic Sci Res. 2025: doi: 10.29328/journal.jfsr.1001085; 9: 092-096
Most Viewed
-
Feasibility study of magnetic sensing for detecting single-neuron action potentialsDenis Tonini,Kai Wu,Renata Saha,Jian-Ping Wang*. Feasibility study of magnetic sensing for detecting single-neuron action potentials. Ann Biomed Sci Eng. 2022 doi: 10.29328/journal.abse.1001018; 6: 019-029
-
Evaluation of In vitro and Ex vivo Models for Studying the Effectiveness of Vaginal Drug Systems in Controlling Microbe Infections: A Systematic ReviewMohammad Hossein Karami*, Majid Abdouss*, Mandana Karami. Evaluation of In vitro and Ex vivo Models for Studying the Effectiveness of Vaginal Drug Systems in Controlling Microbe Infections: A Systematic Review. Clin J Obstet Gynecol. 2023 doi: 10.29328/journal.cjog.1001151; 6: 201-215
-
Prospective Coronavirus Liver Effects: Available KnowledgeAvishek Mandal*. Prospective Coronavirus Liver Effects: Available Knowledge. Ann Clin Gastroenterol Hepatol. 2023 doi: 10.29328/journal.acgh.1001039; 7: 001-010
-
Causal Link between Human Blood Metabolites and Asthma: An Investigation Using Mendelian RandomizationYong-Qing Zhu, Xiao-Yan Meng, Jing-Hua Yang*. Causal Link between Human Blood Metabolites and Asthma: An Investigation Using Mendelian Randomization. Arch Asthma Allergy Immunol. 2023 doi: 10.29328/journal.aaai.1001032; 7: 012-022
-
An algorithm to safely manage oral food challenge in an office-based setting for children with multiple food allergiesNathalie Cottel,Aïcha Dieme,Véronique Orcel,Yannick Chantran,Mélisande Bourgoin-Heck,Jocelyne Just. An algorithm to safely manage oral food challenge in an office-based setting for children with multiple food allergies. Arch Asthma Allergy Immunol. 2021 doi: 10.29328/journal.aaai.1001027; 5: 030-037

HSPI: We're glad you're here. Please click "create a new Query" if you are a new visitor to our website and need further information from us.
If you are already a member of our network and need to keep track of any developments regarding a question you have already submitted, click "take me to my Query."


