Figure 3
To evaluate the stress response to tracheal intubation by macintosh laryngoscope and intubating laryngeal mask airway
Somika Agarwal* and Sapna Bansal
Published: 19 December, 2022 | Volume 6 - Issue 1 | Pages: 007-013
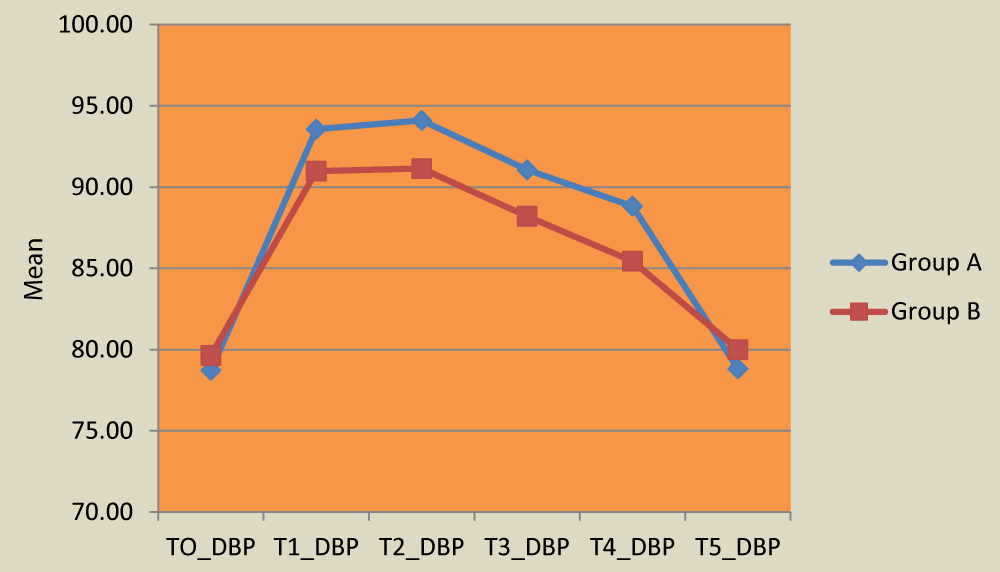
Figure 3:
Figure 3: Distribution of diastolic blood pressure at different time periods in both groups.
Read Full Article HTML DOI: 10.29328/journal.ijcar.1001020 Cite this Article Read Full Article PDF
More Images
Similar Articles
-
To evaluate the stress response to tracheal intubation by macintosh laryngoscope and intubating laryngeal mask airwaySomika Agarwal*,Sapna Bansal. To evaluate the stress response to tracheal intubation by macintosh laryngoscope and intubating laryngeal mask airway. . 2022 doi: 10.29328/journal.ijcar.1001020; 6: 007-013
Recently Viewed
-
Viscosity-sensitive mitochondrial fluorescent probes and their bio-applicationsMengmeng Wei,Rui Yang*. Viscosity-sensitive mitochondrial fluorescent probes and their bio-applications. Ann Adv Chem. 2022: doi: 10.29328/journal.aac.1001029; 6: 038-042
-
Bio-inspired fabrication of zinc oxide nanoparticles: Insight into biomedical applicationsAtta Ullah Khan*,Muhammd Ilyas,Doaa Zamel,Suliman Khan,Abbas Ahmad,Fazeela Kaneez,Sakina Abbas,Syeda Armana Zaidi,Hikmat Ullah,Faisal Adnan,Shehryar Khan,Fazal Rahman,Subhan Ullah Khan. Bio-inspired fabrication of zinc oxide nanoparticles: Insight into biomedical applications. Ann Adv Chem. 2022: doi: 10.29328/journal.aac.1001028; 6: 023-037
-
A reaction and movement of vacancy and solute atom in metals under elastic tensile stressXu Tingdong*. A reaction and movement of vacancy and solute atom in metals under elastic tensile stress. Ann Adv Chem. 2022: doi: 10.29328/journal.aac.1001027; 6: 021-022
-
Bifid Mandibular Canals: A case report and mini reviewSourav Sarkar*,Saini Mondal. Bifid Mandibular Canals: A case report and mini review. J Clin Adv Dent. 2020: doi: 10.29328/journal.jcad.1001015; 4: 006-008
-
Trends in TeledentistryRudrakshi C*. Trends in Teledentistry. J Clin Adv Dent. 2020: doi: 10.29328/journal.jcad.1001014; 4: 004-005
Most Viewed
-
Feasibility study of magnetic sensing for detecting single-neuron action potentialsDenis Tonini,Kai Wu,Renata Saha,Jian-Ping Wang*. Feasibility study of magnetic sensing for detecting single-neuron action potentials. Ann Biomed Sci Eng. 2022 doi: 10.29328/journal.abse.1001018; 6: 019-029
-
Evaluation of In vitro and Ex vivo Models for Studying the Effectiveness of Vaginal Drug Systems in Controlling Microbe Infections: A Systematic ReviewMohammad Hossein Karami*, Majid Abdouss*, Mandana Karami. Evaluation of In vitro and Ex vivo Models for Studying the Effectiveness of Vaginal Drug Systems in Controlling Microbe Infections: A Systematic Review. Clin J Obstet Gynecol. 2023 doi: 10.29328/journal.cjog.1001151; 6: 201-215
-
Prospective Coronavirus Liver Effects: Available KnowledgeAvishek Mandal*. Prospective Coronavirus Liver Effects: Available Knowledge. Ann Clin Gastroenterol Hepatol. 2023 doi: 10.29328/journal.acgh.1001039; 7: 001-010
-
Causal Link between Human Blood Metabolites and Asthma: An Investigation Using Mendelian RandomizationYong-Qing Zhu, Xiao-Yan Meng, Jing-Hua Yang*. Causal Link between Human Blood Metabolites and Asthma: An Investigation Using Mendelian Randomization. Arch Asthma Allergy Immunol. 2023 doi: 10.29328/journal.aaai.1001032; 7: 012-022
-
An algorithm to safely manage oral food challenge in an office-based setting for children with multiple food allergiesNathalie Cottel,Aïcha Dieme,Véronique Orcel,Yannick Chantran,Mélisande Bourgoin-Heck,Jocelyne Just. An algorithm to safely manage oral food challenge in an office-based setting for children with multiple food allergies. Arch Asthma Allergy Immunol. 2021 doi: 10.29328/journal.aaai.1001027; 5: 030-037

HSPI: We're glad you're here. Please click "create a new Query" if you are a new visitor to our website and need further information from us.
If you are already a member of our network and need to keep track of any developments regarding a question you have already submitted, click "take me to my Query."


